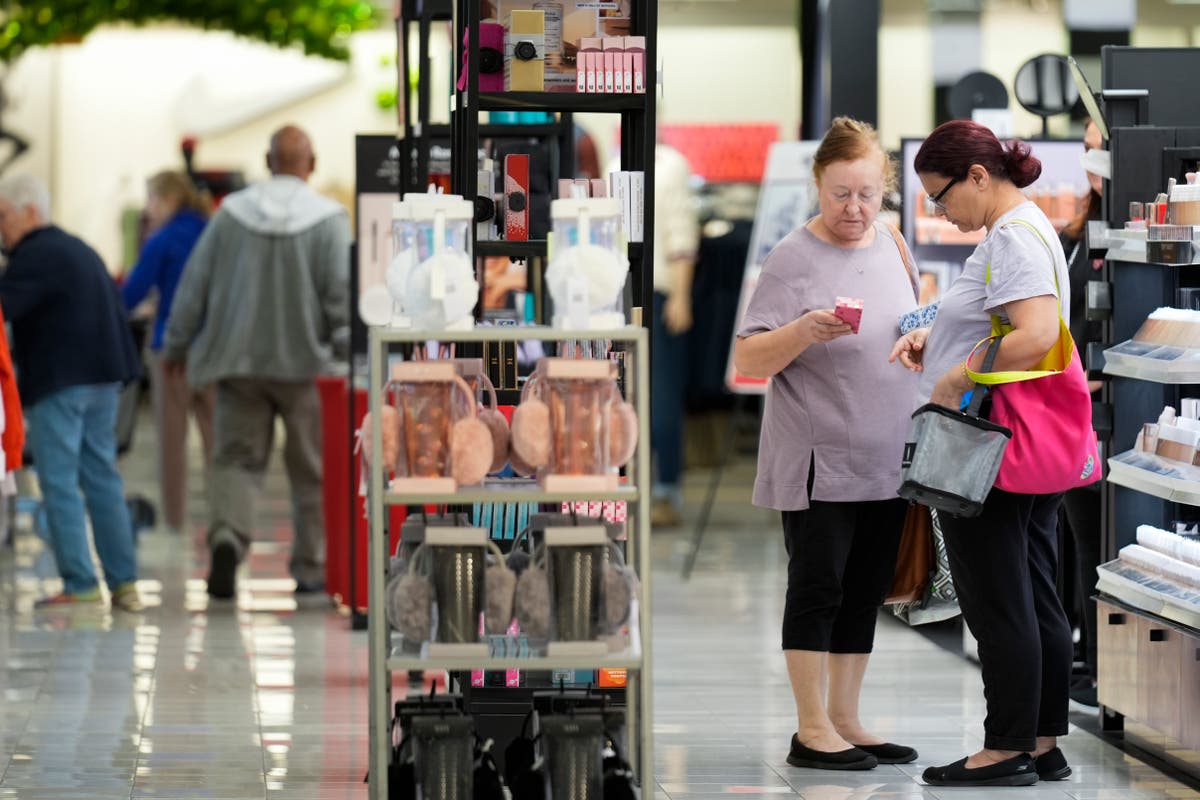
How shoppers spent their money in 2022
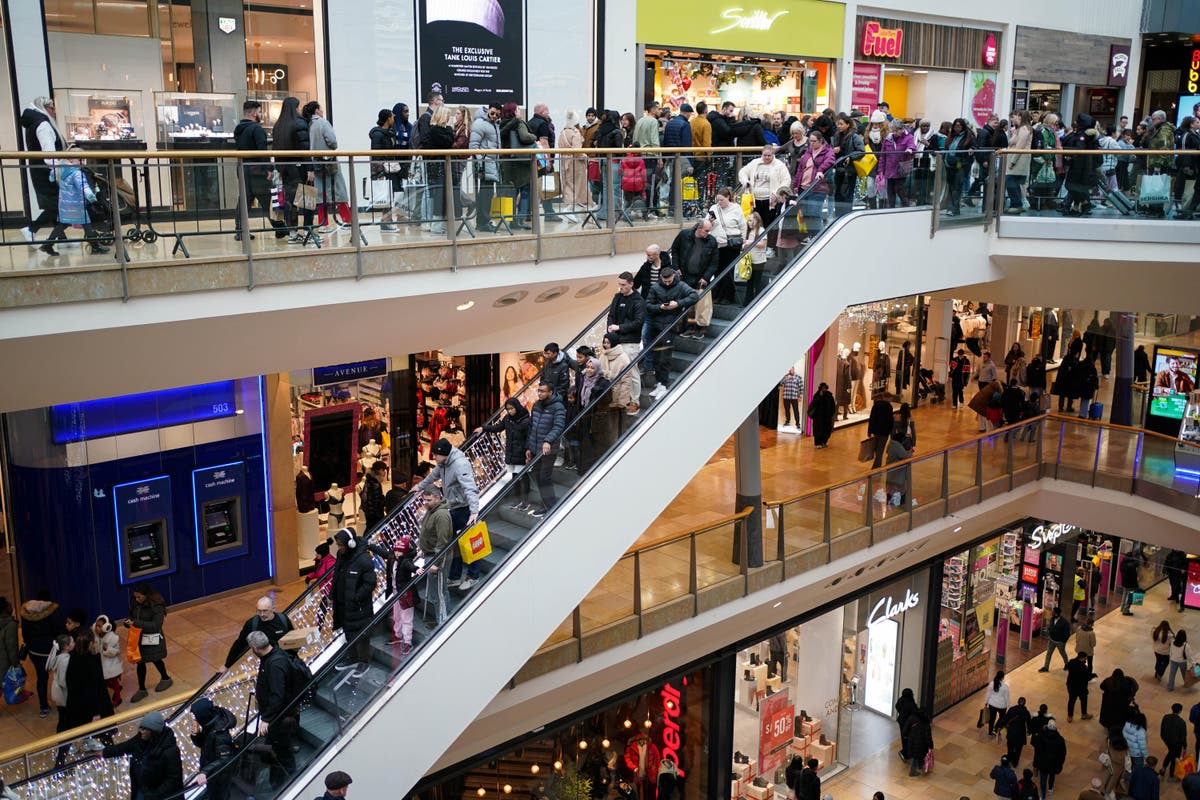
The IndependentSign up to our free money newsletter for investment analysis and expert advice to help you build wealth Sign up to our free money email for help building your wealth Sign up to our free money email for help building your wealth SIGN UP I would like to be emailed about offers, events and updates from The Independent. Read our privacy policy Consumer card spending grew by 10.6 per cent in 2022 – fuelled by holidays abroad and socialising after all lockdown restrictions were lifted, as well as rising inflation. “However, the cost-of-living squeeze has clearly impacted the retail sector.” The data also showed surging energy prices caused purse strings to tighten, with the average customer spending 32.9 per cent more on utilities than last year, based on credit and debit card transactions, as well as direct debits. But not every sector fared so well from the end of restrictions as spending on home improvements fell -5.5 per cent, and digital content and subscriptions saw a decline of -0.8 per cent. “As we head into next year, it’s likely that Brits will remain in a similar mindset – keen to conserve their cash where possible but also happy to splash out on items and experiences that give them a boost once in a while.” CONSUMER SPENDING INDEX 2022 Essential: 6.3% 10.4% Non Essential: 12.9% 13.9% OVERALL: 10.6% 12.5% Retail: -0.8% 5.0% Clothing: 11.2% 14.7% Grocery: -0.1% 7.9% Supermarkets: 0.1% 7.0% Food & Drink Specialist: -1.1% 13.3% Household: -5.4% -2.2% Home Improvements & DIY: -5.5% -7.5% Electronics: -7.2% 5.0% Furniture Stores: -3.3% -0.2% General Retailers: -6.2% -4.7% General Retailers & Catalogues: -9.9% -9.5% Department Stores: 7.4% 14.7% Discount Stores: -2.7% 1.1% Specialist Retailers: 5.7% 12.1% Pharmacy, Health & Beauty: 14.7% 18.3% Sports & Outdoor: -2.8% 4.0% Other Specialist Retailers: 3.6% 8.1% Hospitality & Leisure: 45.1% 25.5% Digital Content & Subscriptions: -0.8% -1.6% Eating & Drinking: 30.8% 30.5% Restaurants: 37.1% 34.9% Bars, Pubs & Clubs: 53.6% 66.1% Takeaways and Fast Food: 12.3% 15.8% Other Food & Drink: 37.9% 30.5% Entertainment: 41.1% 49.2% Hotels, Resorts & Accommodation: 27.5% 39.4% Travel: 115.5% 39.6% Travel Agents: 190.6% 124.5% Airlines: 132.1% 115.7% Public Transport: 55.9% 40.7% Other Travel: 57.3% 26.2% Other: 9.7% 13.2% Fuel: 28.3% 7.9% Motoring: 2.0% 35.6% Other Services: 3.6% 8.7% Insperiences: 4.1% 6.4% Online: 4.3% -2.2% Face-to-Face: 16.4% 19.6%
History of this topic
Last-minute Christmas shopping takes a dive as buyers feel the squeeze
The Independent
U.S. shoppers sharply boosted spending at retailers in July despite higher prices
LA TimesOngoing sales have boosted spending during a cost-of-living crisis. Will shoppers pay the price with an interest rate rise?
ABC
Baby Reindeer success comes amid jump in subscription spending – Barclays
The Independent
Consumers in Netherlands are spending less on shopping but more at restaurants
NL Times
Shoppers face £380 jump in grocery bills this year as inflation surges
The IndependentDiscover Related
